TAChart Tutorial: BarSeries/ru
│
Deutsch (de) │
English (en) │
suomi (fi) │
русский (ru) │
Введение
Библиотека TAChart различные диаграммы в Lazarus. Но в отличии от других типов рядов, гистограммы (столбчатые диаграммы) кажутся более сложными, главным образом потому, что существует широкий спектр возможностей:
- смежные столбцы
- сложенные столбцы
- сложенные столбцы, приведенных к 100%
- вертикальные столбцы
- горизонтальные столбцы
В этом руководстве мы хотим показать вам принципы того, как создать диаграмму с несколькими рядами столбцов, расположенными смежно. follow-up tutorial научит вас, как сложить столбцы друг над другом.
Помимо гистограмм в этом руководстве будет представлен TRandomChartSource, который является стандартным инструментом для разработки диаграммы без необходимости компиляции приложения.
Вам понадобятся некоторые базовые знания в Pascal и в Lazarus. Взгляните на TAChart Tutorial: Getting started, чтобы изучить некоторые базовые навыки работы с TAChart, если эта библиотека новая для Вас. Мы также рекомендуем TAChart documentation.
Подготовка
Настройка диаграммы
Создайте новый проект, сохраните его.
Добавьте компонент TChart из палитры компонентов Lazarus на Form1, смасштабируйте его, чтобы заполнить заданную область формы.
Данные для вывода
Прежде чем продолжить, давайте подумаем о том, какие данные мы хотим вывести. Возможно, вы могли бы использовать баланс своих чековых и сберегательных счетов, или бизнес-отчеты крупных компаний, найденные где-нибудь в Интернете, или что-то совершенно другое...
Давайте на этот раз пойдем другим путем: почему бы нам не построить график только случайных данных? Конечно, они ничего не значат, но они просты и очень удобны для того, чтобы потренироваться с компонентом. В частности, TAChart содержит компонент TRandomChartSource который предоставляет случайные данные, подключающиеся к диаграммам прямо во время разработки. Это означает, что вы можете следовать этому руководству без необходимости написания хотя бы одной строчки кода и без необходимости компилировать демонстрационное приложение. Позже, когда работа над макетом будет завершена, вы можете удалить источники случайных диаграмм и заменить их источниками диаграмм, содержащими наши данные.
Как вы вскоре увидите, на графике будет три ряда, каждый из которых, к примеру, с четырьмя столбцами. Для каждой серии вам понадобится RandomChartSource. Чтобы добавить RandomChartSource вгляните на палитру компонентов "Диаграммы" - это третий значок на палитре, подсвеченный красным на скриншоте ниже:
Добавьте в форму три источника случайных диаграмм - по одному на серию. Переименуйте в RedChartSource, BlueChartSource и YellowChartSource таким образом, что они будут связаны с красным "red", синим "blue" и желтым "yellow" сериями диаграмм, которые сразу будут созданы (Вы всегда должны использовать "говорящие" названия для переменных.)
Прежде чем сделать это, нам нужно настроить источники случайных диаграмм, потому что по умолчанию они не предоставлят никаких данных. Мы хотим, чтобы в каждой серии было по четыре диаграммы. Поэтому установите свойство PointsNumber в значение 4. Чтобы метки осей синхронизировались со столбцами, ось x должна находиться в диапазоне от 1 до 4 ( или от 0 до 3, или от 0 до 39, как Вам угодно - мы обсудим метки осей более подробно позже): XMin = 1, XMax = 4. И, наконец, мы также должны указать диапазон осей y, можно выбрать YMin = 0 и YMax = 100.
Ряды столбцов
Добавление рядов
Теперь, когда все приготовления закончены, мы можем добавить ряд столбцов на диаграмму. Дважды щелкните по диаграмме, чтобы открыть редактор рядов (series). Нажмите "Добавить" и выберите "Ряд столбцов" из списка. Повторите дважды. В конце концов, у нас есть три ряда столбцов на графике. Мы не видим их на диаграмме, так как они еще не связаны с нашими данными. Однако в дереве объектов Инспектора объектов ряды отображаются как дочерние элементы узла диаграммы.
Щелкните на первом ряду в дереве объектов и - в Инспекторе объектов - перейдите к свойству Source и выберите RedChartSource из списка. Теперь ряды становятся видимыми на диаграмме. Для того, чтобы сделать его красным "red" перейдите к его свойству SeriesColor и выберите цвет clRed. Переименуйте ряд в "RedBarSeries", и измените заголовок (title) на "красный". Последнее предназначено для легенды, которую мы включаем, устанавливая Legend.Visible в true.
Повторите все это с двумя другими рядами аналогично.
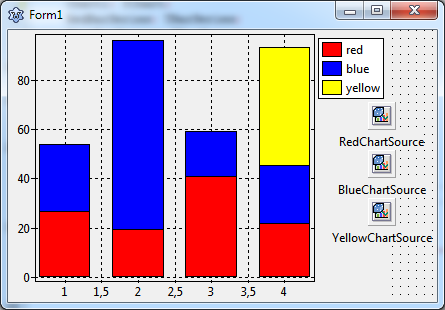
Теперь на графике отображается ряд столбцов (гистограмма). Однако столбики расположены на одном и том же значении оси X, желтые столбики частично закрыты другими столбиками. Давайте исправим это.
Side-by-side arrangement of bars
In oder to arrange the bars of each group (i.e. bars corresponding to the same x value) side-by-side, we have to shift them horizontally. TBarSeries offers two properties for this purpose:
BarWidthPercentBarOffsetPercent
Both numbers are expressed as a percentage of the distance to the next bar group. (In some charts, the bars are not equidistant and therefore get varying bar widths. To achieve a constant bar thickness in such a case, set the property BarWidthStyle to bwPercentMin.)
The basic idea is that the space between the bar groups (100%) is divided by the bars and some empty space to the next group. If we want to leave a gap of - say - one bar width between the groups, we have to divide 100% by 4 (3 bars plus gap), i.e. each bar can occupy a width of 25%.
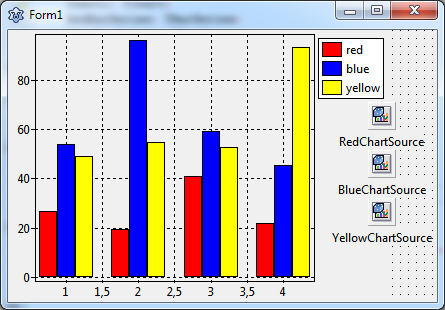
So, let's set the BarWidthPercent to 25% and see what happens. Oh - not quite what we wanted: The bars did get narrower, but they are still overlapping. Of course, this happens because we did not change the BarOffsetPercent parameter.
Currently, BarOffsetPercent is zero which means that the center of each bar is exactly at the position of the axis tick mark. We have to shift the red bars to the left and the yellow bars to the right such that they touch the blue bars which remain in the center. The shift difference is one bar width, i.e. 25%. For moving the red bars to the left their BarOffsetPercent has to be negative.
In summary, we use the following values:
RedBarSeries: BarOffsetPercent = -25, BarWidthPercent = 25BlueBarSeries: BarOffsetPercent = 0, BarWidthPercent = 25YellowBarSeries: BarOffsetPercent = 25, BarWidthPercent = 25
Axis
Using text labels
The next issue to be addressed is the x axis. Usually bar charts are considered to display categories of some data sets which often requires text labels underneath each bar group. But so far, we only have numerical labels, and the intermediate labels at half integers are particularly annoying.
The best way to get this right is to use an additional ChartSource for assigning the strings to the axis values, it is a TListChartSource this time to be found as the second icon in the chart component palette (immediately to the left of the TRandomChartSource.) Add it to the form and rename is as LabelsChartSource.
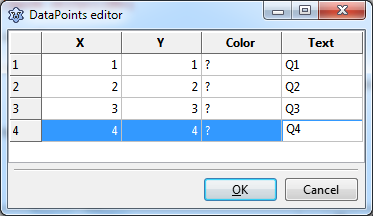
The ListChartSource has a built-in data editor which allows to enter data at design-time. Select the LabelsChartSource and go to the property DataPoints. Click on "..." at the right to open the data points editor, and enter the following data:
In the "X" column we enter the values of the x coordinates of each bar group. We could omit the "Y" column, but as we'll see later that it is conventient to have the same data in this column as well because labels are retained after rotation of the bars to an horizontal arrangement. In the column "Text" we specify the texts that will appear for each bar group along the axis as axis marks. Let us assume that our data represent some seasonal values and use the abbreviations "Q1", "Q2", "Q3", and "Q4" for "quarter 1" etc. Column "Color" can be left empty.
In order to activate these labels we have to assign this ChartSource to the Source property of the Marks of the bottom axis, and we have to set the property Style of the Marks to smsLabel.
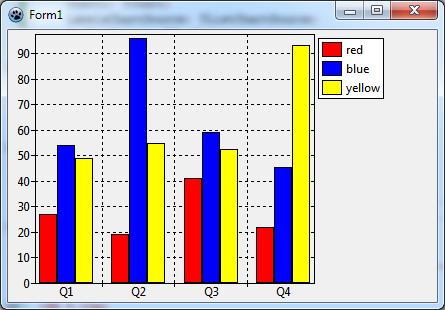
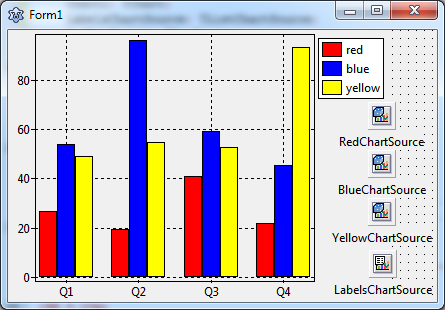
Voila - here's what we get:
Showing grid lines & ticks between groups
A minor issue can be improved: the chart would be clearer if the axis tick marks and grid lines were not at the center of the bar groups, but right between them.
At first, we turn off the grid of the bottom axis: BottomAxis.Grid.Visible = false. To remove the ticks, we can set the TickLength and the TickInnerLength to 0.
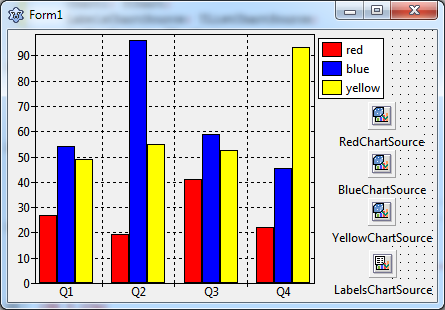
But how to add grid lines between the chart groups? This can be done by creating a "minor" axis to the bottom axis. This is another set of ticks and gridlines in addition to the "major" axis. Go to the bottom axis and click on Minors to open the corresponding editor. Click "Add" and the select the 0 - M in the list. Back in the normal Object Inspector, activate Visible, increase the TickLength to 4, and finally, set Intervals.Count to 1 - we only want one minor tick between the major ticks. Check the Grid settings - Visible should be true.
This leads to the final result. Final? Not quite! There is an annoying little gap underneath the bars. This originates from the chart's Margins property which leaves some distance between the series and the axes. Just set Chart.Margins.Bottom to 0 to remove the gap.
Horizontal bar series
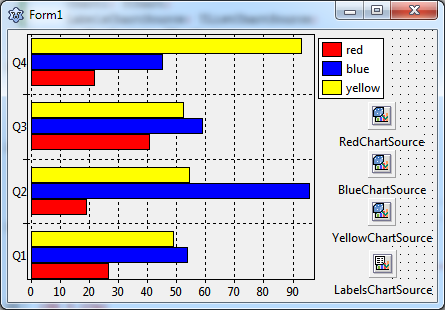
Before closing this lesson we'd like to quickly modify this project and create a plot with horizontal bars. This kind of diagram is often preferred when the axis labels consist of lengthy texts, and the chart is in a landscape orientation.
TAChart does not offer a dedicated "THorizontalBarSeries", but the standard TBarSeries can easily be modified to obtain horizontal bars. Like any other descendant of TChartSeries it has properties AxisIndexX and AxisIndexY to indicate which axis is responsible for x and y coordinates. Just set AxisIndexX to the index of the LeftAxis (usually 0) and AxisIndexY to that of the BottomAxis in order to rotate the bar direction.
And, of course, the LabelsChartSource has to be linked to the Marks.Source of the LeftAxis this time. And the minor axis has to be handled accordingly.
Essentially, that's all that's needed to create a chart with horizontal bars.
Summary
Steps to create a side-by-side bar chart:
- Every bar requires a separate BarSeries.
- Use the BarSeries' properties
BarWidthPercentandBarOffsetPercentto arrange the bars side-by-side with or without overlapping. The percentages refer to the distance between the center of the bar groups. - For horizontal bar series, set the series'
AxisIndexXto the index of the chart'sLeftAxis(usually0) andAxisIndexYto the index of theBottomAxis(usually1).
Source code
The source code of this tutorial is available in the folder components/tachart/tutorials/bar_series of your TAChart installation of newer Lazarus versions.
Project file
program project1;

{$mode objfpc}{$H+}

uses
  {$IFDEF UNIX}{$IFDEF UseCThreads}
  cthreads,
  {$ENDIF}{$ENDIF}
  Interfaces, // this includes the LCL widgetset
  Forms, tachartlazaruspkg, Unit1
  { you can add units after this };

{$R *.res}

begin
  RequireDerivedFormResource := True;
  Application.Initialize;
  Application.CreateForm(TForm1, Form1);
  Application.Run;
end.
Unit1.pas
unit Unit1;

{$mode objfpc}{$H+}

interface

uses
  Classes, SysUtils, FileUtil, Forms, Controls, Graphics, Dialogs, TAGraph,
  TASeries, TASources;

type

  { TForm1 }

  TForm1 = class(TForm)
    Chart1: TChart;
    LabelsChartSource: TListChartSource;
    RedBarSeries: TBarSeries;
    BlueBarSeries: TBarSeries;
    YellowBarSeries: TBarSeries;
    RedChartSource: TRandomChartSource;
    BlueChartSource: TRandomChartSource;
    YellowChartSource: TRandomChartSource;
  private
    { private declarations }
  public
    { public declarations }
  end;

var
  Form1: TForm1;

implementation

{$R *.lfm}

end.
Unit1.lfm (vertical bars)
object Form1: TForm1
  Left = 381
  Height = 272
  Top = 444
  Width = 429
  Caption = 'Form1'
  ClientHeight = 272
  ClientWidth = 429
  LCLVersion = '1.3'
  object Chart1: TChart
    Left = 0
    Height = 272
    Top = 0
    Width = 384
    AxisList = <
      item
        Minors = <>
        Title.LabelFont.Orientation = 900
      end
      item
        Grid.Visible = False
        TickLength = 0
        Alignment = calBottom
        Marks.Format = '%2:s'
        Marks.Source = LabelsChartSource
        Marks.Style = smsLabel
        Minors = <
          item
            Intervals.Count = 1
            Intervals.MinLength = 5
            Intervals.Options = [aipUseCount, aipUseMinLength]
            TickLength = 4
          end>
      end>
    Foot.Brush.Color = clBtnFace
    Foot.Font.Color = clBlue
    Legend.Visible = True
    Margins.Bottom = 0
    Title.Brush.Color = clBtnFace
    Title.Font.Color = clBlue
    Title.Text.Strings = (
      'TAChart'
    )
    ParentColor = False
    object RedBarSeries: TBarSeries
      Title = 'red'
      BarBrush.Color = clRed
      BarOffsetPercent = -25
      BarWidthPercent = 25
      Source = RedChartSource
    end
    object BlueBarSeries: TBarSeries
      Title = 'blue'
      BarBrush.Color = clBlue
      BarWidthPercent = 25
      Source = BlueChartSource
    end
    object YellowBarSeries: TBarSeries
      Title = 'yellow'
      BarBrush.Color = clYellow
      BarOffsetPercent = 25
      BarWidthPercent = 25
      Source = YellowChartSource
    end
  end
  object RedChartSource: TRandomChartSource
    PointsNumber = 4
    RandSeed = 1
    XMax = 4
    XMin = 1
    YMax = 100
    YMin = 0
    left = 360
    top = 72
  end
  object BlueChartSource: TRandomChartSource
    PointsNumber = 4
    RandSeed = 2
    XMax = 4
    XMin = 1
    YMax = 100
    YMin = 0
    left = 360
    top = 120
  end
  object YellowChartSource: TRandomChartSource
    PointsNumber = 4
    RandSeed = 3
    XMax = 4
    XMin = 1
    YMax = 100
    YMin = 0
    left = 360
    top = 168
  end
  object LabelsChartSource: TListChartSource
    DataPoints.Strings = (
      '1|1|?|Q1'
      '2|2|?|Q2'
      '3|3|?|Q3'
      '4|4|?|Q4'
    )
    left = 361
    top = 220
  end
end
Unit1.lfm (horizontal bars)
object Form1: TForm1
  Left = 381
  Height = 272
  Top = 444
  Width = 429
  Caption = 'Form1'
  ClientHeight = 272
  ClientWidth = 429
  LCLVersion = '1.3'
  object Chart1: TChart
    Left = 0
    Height = 272
    Top = 0
    Width = 384
    AxisList = <
      item
        Grid.Visible = False
        TickLength = 0
        Marks.Format = '%2:s'
        Marks.Source = LabelsChartSource
        Marks.Style = smsLabel
        Minors = <
          item
            Intervals.Count = 1
            Intervals.MinLength = 5
            Intervals.Options = [aipUseCount, aipUseMinLength]
            TickLength = 4
          end>
        Title.LabelFont.Orientation = 900
      end
      item
        Alignment = calBottom
        Minors = <>
      end>
    Foot.Brush.Color = clBtnFace
    Foot.Font.Color = clBlue
    Legend.Visible = True
    Margins.Bottom = 0
    Title.Brush.Color = clBtnFace
    Title.Font.Color = clBlue
    Title.Text.Strings = (
      'TAChart'
    )
    ParentColor = False
    object RedBarSeries: TBarSeries
      Title = 'red'
      AxisIndexX = 0
      AxisIndexY = 1
      BarBrush.Color = clRed
      BarOffsetPercent = -25
      BarWidthPercent = 25
      Source = RedChartSource
    end
    object BlueBarSeries: TBarSeries
      Title = 'blue'
      AxisIndexX = 0
      AxisIndexY = 1
      BarBrush.Color = clBlue
      BarWidthPercent = 25
      Source = BlueChartSource
    end
    object YellowBarSeries: TBarSeries
      Title = 'yellow'
      AxisIndexX = 0
      AxisIndexY = 1
      BarBrush.Color = clYellow
      BarOffsetPercent = 25
      BarWidthPercent = 25
      Source = YellowChartSource
    end
  end
  object RedChartSource: TRandomChartSource
    PointsNumber = 4
    RandSeed = 1
    XMax = 4
    XMin = 1
    YMax = 100
    YMin = 0
    left = 360
    top = 72
  end
  object BlueChartSource: TRandomChartSource
    PointsNumber = 4
    RandSeed = 2
    XMax = 4
    XMin = 1
    YMax = 100
    YMin = 0
    left = 360
    top = 120
  end
  object YellowChartSource: TRandomChartSource
    PointsNumber = 4
    RandSeed = 3
    XMax = 4
    XMin = 1
    YMax = 100
    YMin = 0
    left = 360
    top = 168
  end
  object LabelsChartSource: TListChartSource
    DataPoints.Strings = (
      '1|1|?|Q1'
      '2|2|?|Q2'
      '3|3|?|Q3'
      '4|4|?|Q4'
    )
    left = 361
    top = 220
  end
end
