WebAssembly/Debugging
Free Pascal can now create WebAssembly binaries with DWARF debug info. This allows debugging WebAssembly applications.
Debug info
DWARF
Free Pascal for WebAssembly generates debug info that follows the WebAssembly DWARF specification.
Using the -g compiler option enables debug info generation. Due to limitations of the LLVM assembler and linker, this only works with FPC's internal assembler and linker, so make sure you're not compiling with -a or -Xe.
Name section
Free Pascal now also produces a name section in the WebAssembly binary. This is a custom section, that adds function names to all the functions inside the module. This is very limited information, compared to DWARF, but is still helpful, because there are more tools that support it. The integrated debuggers in Mozilla Firefox and Google Chrome support that info and show the function names in the assembly level view of the module.
Source maps
Source maps are JSON files that have been used traditionally for mapping generated (or minified) JavaScript files to their source. In principle, they are not a good fit for WebAssembly, which uses a binary format, and they are less powerful, compared to DWARF, because they only provide mapping to the source, without any extra information for examining variables and types. However, they're still useful as a stop gap solution, because they're widely supported by browser debuggers and some browsers (like Mozilla Firefox) still haven't implemented DWARF support.
Free Pascal doesn't support generating source maps directly, however there are third party tools that allow generating a source map from the embedded DWARF debug info. One such tool that has been tested and known to work is wasm2map.
Example usage:
cargo-wasm2map wasm2map --patch --base-url http://localhost:8080 --bundle-sources myproject.wasm
This will produce a file myproject.wasm.map.
The --patch option embeds a link to the source map file inside the .wasm binary, so that browsers know where to find it. The -base-url option specifies the prefix to the location of the map file. In this example, the location embedded in the .wasm file will be http://localhost:8080/myproject.wasm.map
The --bundle-sources embeds the source files inside the .map file. Without this option, you would need to host your sources on the same http server (and recreate the original directory tree), where you host the source map.
Debugging
Debugging with Chrome/Chromium
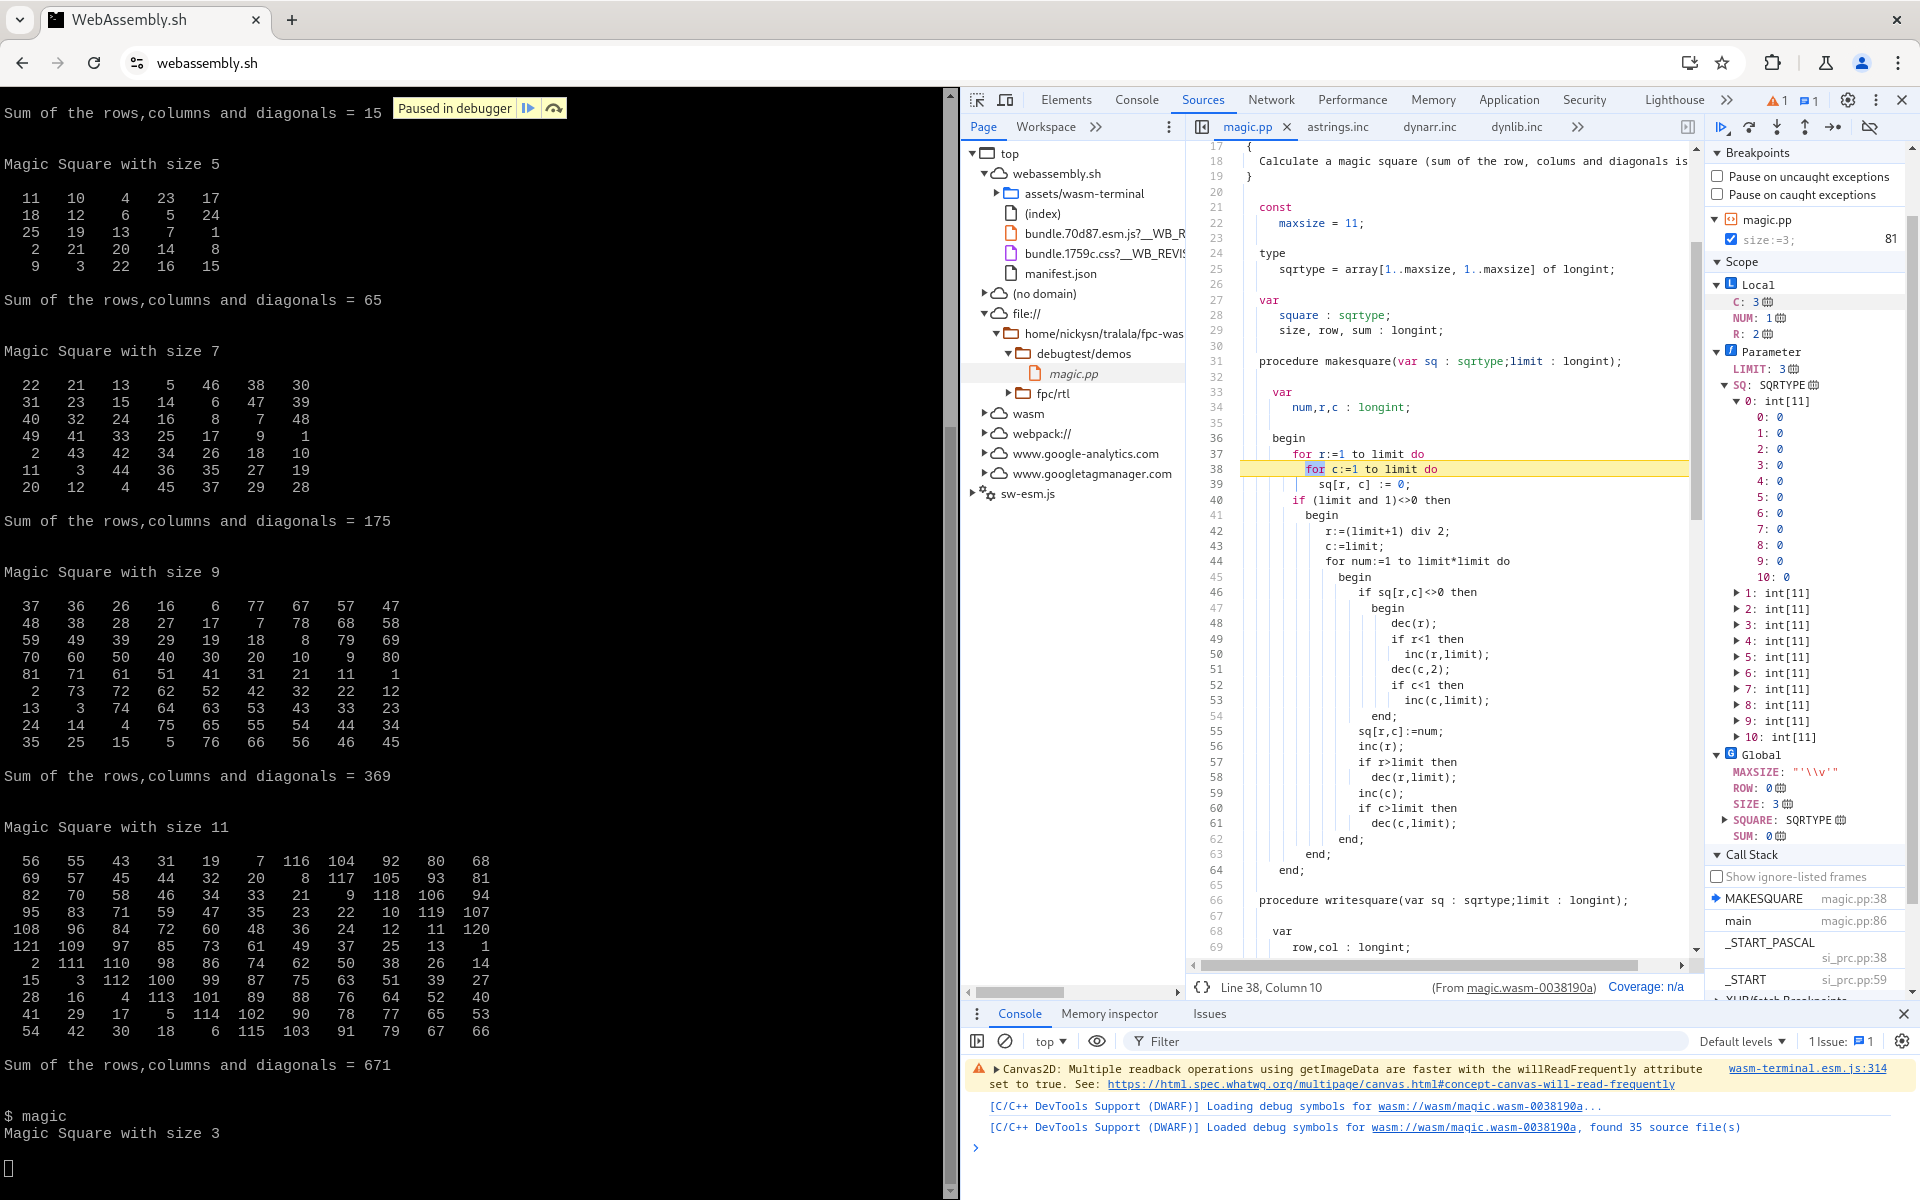
Chrome has a plugin for debugging C/C++ applications, called C/C++ DevTools Support (DWARF). It works with Free Pascal as well. It allows setting breakpoints, stepping inside the program, and showing local and global variables, as well as function parameters of various types. Note that the plugin is in BETA, and is designed for C and C++, so it may not support all Pascal types.
Here's a screenshot of a debugging session of a Pascal program in Chromium:

Debugging with Wasmtime
Wasmtime supports debugging WebAssembly programs with gdb or lldb. Even though these debuggers don't support WebAssembly directly, debugging becomes possible, because Wasmtime performs JIT compilation of the WebAssembly bytecode to native code, and it also (optionally) translates the DWARF debug info, so that native debuggers can work with it.
Using GDB
To enable the debugger support and run your program inside gdb, use:
gdb --args wasmtime run -D debug-info -O opt-level=0 foo.wasm
Note that running the program inside the debugger will not enter the Pascal code immediately. First, it'll run Wasmtime's code that JIT compiles the program. To skip that, you need to set a breakpoint somewhere in the Pascal code.
Setting a breakpoint
Generally, you can set this breakpoint in one of two ways:
in the Pascal code directly
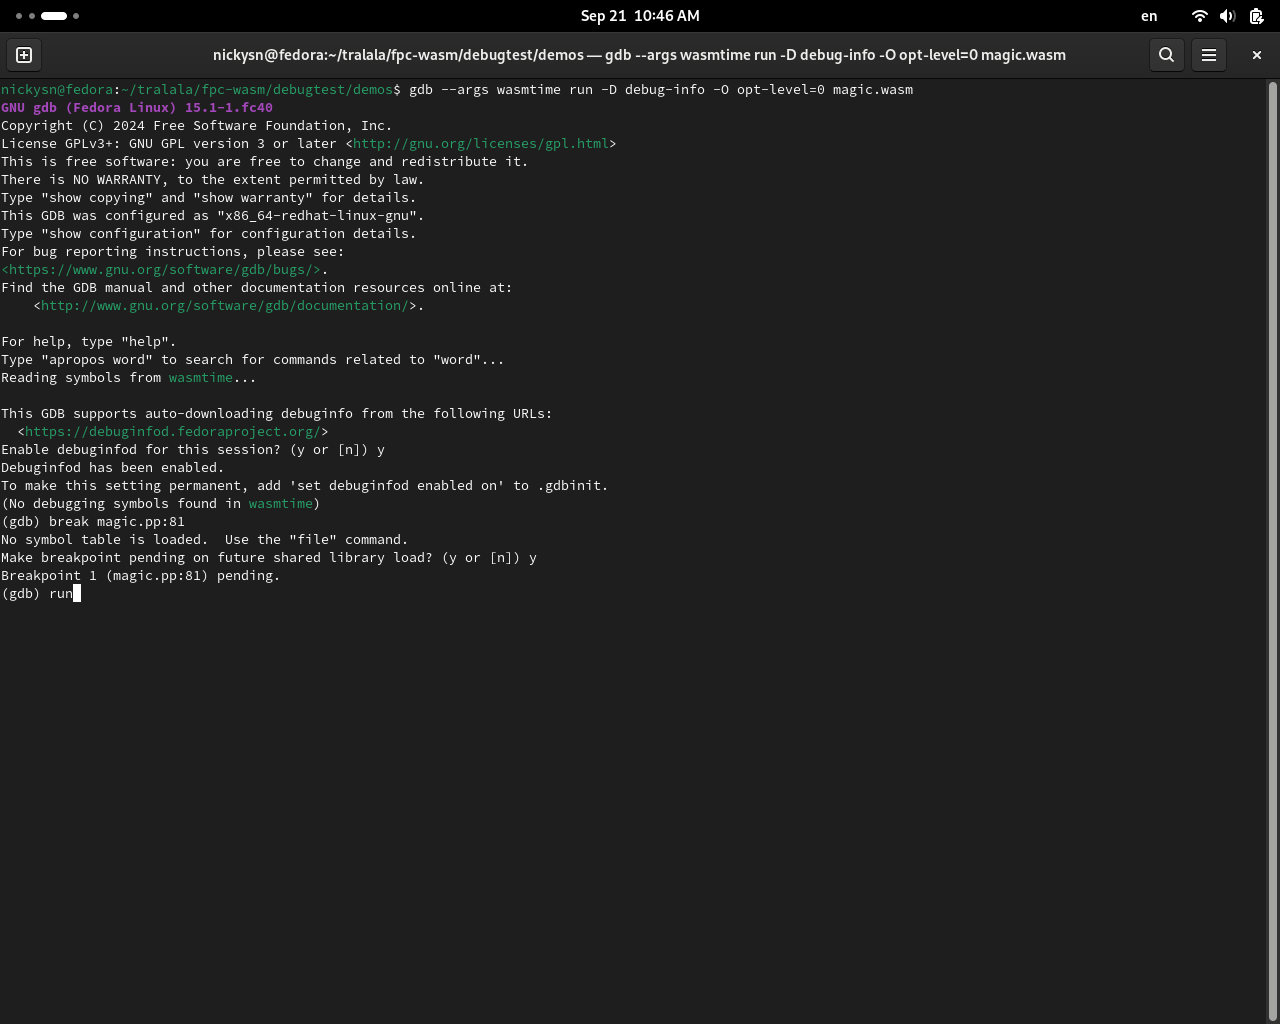
To do this, type at the gdb command prompt:
break magic.pp:81
This will add a breakpoint in magic.pp, line 81. Since the DWARF debug info for the WebAssembly program hasn't been transformed, yet, you get this prompt, because gdb doesn't know about the Pascal source, yet:
No symbol table is loaded.  Use the "file" command.
Make breakpoint pending on future shared library load? (y or [n])
Answer yes to this prompt. Then you get:
Breakpoint 1 (magic.pp:81) pending.
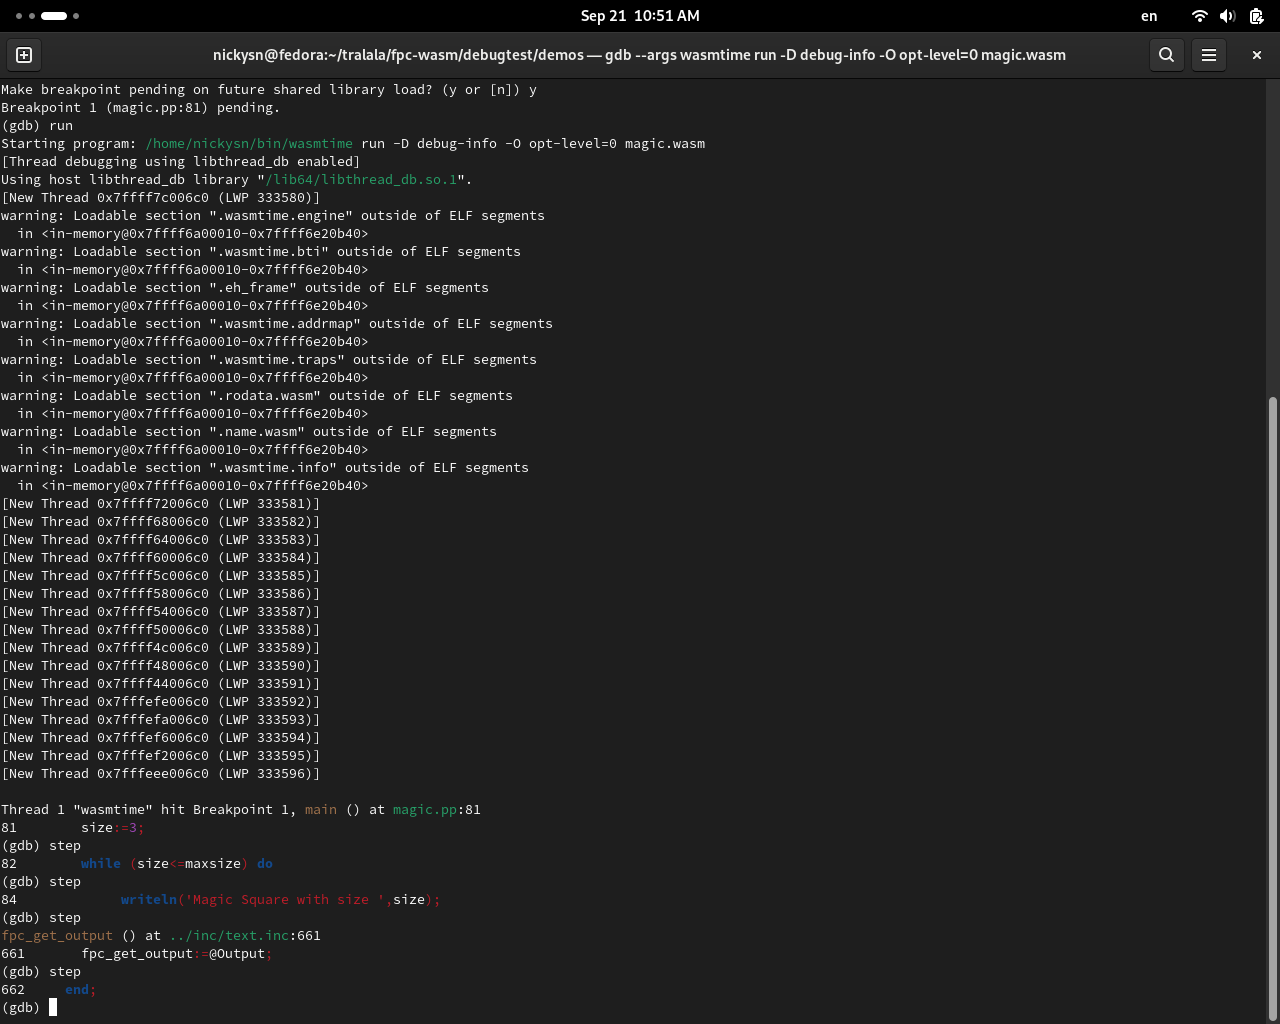
After that, type run at the gdb prompt, and if everything worked well, you should hit your Pascal breakpoint:
 Thread 1 "wasmtime" hit Breakpoint 1, main () at magic.pp:81
81   size:=3;
(gdb)
Screenshots from a debug session, initiated this way:
on entry of the main program
You can also set a breakpoint to the main() function. The only detail you need to know is that, you will hit main() twice. First time it'll be Wasmtime's main. The second main() will be the Pascal main program. So, use the following commands:
break main
run
continue
At this point, if everything is ok, you should be inside the first line of your Pascal main program.
Using LLDB
To start a debugging session with LLDB, use:
lldb -- wasmtime run -D debug-info -O opt-level=0 foo.wasm

