IDE Window: Assembler
│
English (en) │
français (fr) │
Main Menu > View > Debug Windows > Assembler
CallStack Window > Context menu > View Assembler
Important
You must setup the debugger and start the project to debug it. Only then this window will be useful.
Assembler
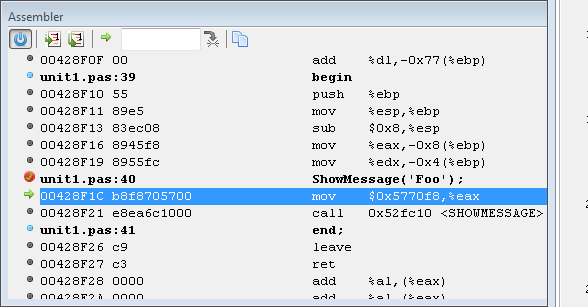
Shows an assembler view of the current code. This can be used with the Registers window.
Data displayed
- Address
- Hex dump
- Asm statement
- The output depends on your CPU
- Pascal lines
- If Pascal sources are available, then they are shown in front of their ASM representation.
Interface
- Vertical Srollbar
- The vertical scrollbar behaves different from normal scrollbars. Since the assembly data may continue to an unknown extend in both directions, there is no fixed range. Move and hold the slider in either direction to scroll. The further you move the slider from the center position the faster the scroll. If released the slider returns to the center.
Toolbar
 Power
Power- Switch off the disassembler. The current disassembled data is kept as is. If the current location changes, it will be indicated only within the data. Introduced to deal with slow data loading since fetching any data from gdb takes noticeable time. It offers a quick way to temporarily disable loading so that other debug windows may be able to display their data sooner.
 Step over or into (one asm instruction)
- Single step (into) one asm instructions, instead of on entire pascal instructions. Will enter subroutines.
 Step over (one asm instruction)
- Single step (over )one asm instructions, instead of on entire pascal instructions. Will skip over subroutines.
 Return to current address
- Returns to the current execution-point.
 Goto custom address
- Shows the data at the address entered in the input field.
 Copy to clipboard
- Copies the selected line(s) to the clipboard.
Context menu
Copies the selected line(s) to the clipboard.
Using the same or different keys for Pascal and ASM stepping
The default keyboard settings are:
- F7 or F8: step into/over one pascal instruction
- Alt-F7 or Alt-F8: step into/over one asm instruction
Those keys will act, independent of the focused window.
In the keyboard mapping (editor options) under "Run Menu" are also entries:
- Alt-⇧ Shift-F7 or Alt-⇧ Shift-F8: "Step into,over (Context)
Those will step asm only if the assembler window is focused, and step pascal otherwise.
The key mapping can be changed, for the unmodified F7/F8 to act on context.
Improve speed using the power button
The debugger will disassemble the required memory range after each step, or each run. This may require some time.
During single stepping the next execution point often is in already disassembled data. If you code is not self-modifying, then you can use the power button to disable the repeated disassembling. Once you stepped to the border of the disassembled range, you need to turn power on to allow disassembling the next block of data. Once you have the next block of data turn it off again. And so on.
Scope
The assembler window does not follow any scope.
The Stack window (context menu) allows to jump to the address of any stackframe. This acts like jumping to a custom address, the ![]() button will always return to the execution point at the top stack frame.
button will always return to the execution point at the top stack frame.
