IDE Window: Breakpoints
From Free Pascal wiki
(Redirected from IDE Window: Break Points)
Jump to navigationJump to search
│
Deutsch (de) │
English (en) │
français (fr) │
русский (ru) │
Main Menu > View > Debug Windows > BreakPoints
Important
You must setup the debugger and start the project to debug it. Only then will this window be useful.
![]() Note: About Data/Watch breakpoints:
Note: About Data/Watch breakpoints:
- When setting the data/watch breakpoint the variable - which should be watched - must be in scope. (That is the program must be running and stopped at a breakpoint where the variable can be seen).
- For that reason data/watch breakpoints are only valid until the app exits and then will be disabled. On the next debug they must be enabled again while stopped at a location where it is in scope.
Breakpoint list
There are 3 kind of breakpoints:
- Source Breakpoint
- Specified by Unit-name and Line-number. The execution will be interrupted before the pascal statement on the specified line is executed. Can be set by clicking the gutter in the source-editor.
- Address Breakpoint
- Specified by an address. The execution will be interrupted before the assembler statement at the address is executed. Can be set by clicking the gutter in disassembler window.
- Data/Watch Breakpoint
- Specified by the name of a variable. The execution will be interrupted when the variable is changed. It can also detect read access. Support for this depends on the platform used.
Data displayed
- State
- A breakpoint can be enabled or disabled. If it is enabled, then each time the program reaches the breakpoint, the condition is checked and if results true, the action(s) set for the breakpoint will be performed.
- Filename/Address
Line/Length: Depending on the type of the breakpoint the following is displayed: -
- Source Breakpoint:
Filename/Address: The name of the file where the breakpoint is set.
Line/Length: The line-number where the breakpoint is set. - Address Breakpoint:
Filename/Address The address of the breakpoint. This type of breakpoint is useful if there is no source available.
Line/Length: This is empty - Data Breakpoint:
Filename/Address: The name of the variable.
Line/Length: Will show the scope ("Global" / "Declaration") and the mode ("Read" / "Write" / "Read/Write")
- Source Breakpoint:
- Condition
- Normally a reached breakpoint performs the break action(s). When a condition is defined, this condition is evaluated. If this condition evaluates to True, the break action(s) are performed.
- Action
- The following actions are available: Break, Enable/Disable group(s), Log message, Evaluate expression, Ignore/Handle Exceptions. A complete description of these actions can be found on the Breakpoint properties page.
- Pass Count
- How many times the enabled breakpoint has been reached. If a "Hitcount" is defined for this breakpoint, the debugger will perform the break action(s) when the hitcount is reached.
- Group
- The group where this breakpoint belongs to. This allows to quickly enabled/disable several breakpoints at once.
Interface
Toolbar
 Enable/
 Disable
- Enables/Disables individual breakpoint(s).
 Remove
- Deletes the selected Breakpoint(s)
 Enable all/
 Disable all
- Enables/Disables all breakpoints.
 Delete all
- Deletes all Breakpoints
 Properties
- Change the properties of the current/selected breakpoint.
Context menu
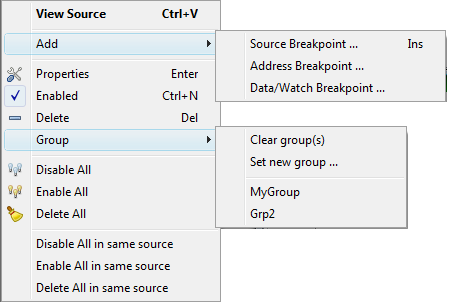
- View Source
- Jump to the source. (Only Source-Breakpoints)
- Add
- Opens a property dialog for the requested type of breakpoint. The location/address/variable can be set in the property dialog.
- Enabled
- Toggle the enabled state for individual breakpoint(s)
- Delete
- Deletes the selected Breakpoint(s)
- Group
- Clears or sets the group for the breakpoint. A list of existing groups will be in the menu. With "Set new group" a new group can be created.
- Enable all/Disable all
- Enables/Disables all breakpoints.
- Delete all
- Deletes all Breakpoints
- Disable all in same source/Enable all in same source
- Enables/Disables all breakpoints in the same unit as the current selected breakpoint. (Only Source-Breakpoints)
- Delete all in same source
- Deletes all Breakpoints in the same unit as the current selected breakpoint. (Only Source-Breakpoints)
Breakpoint properties
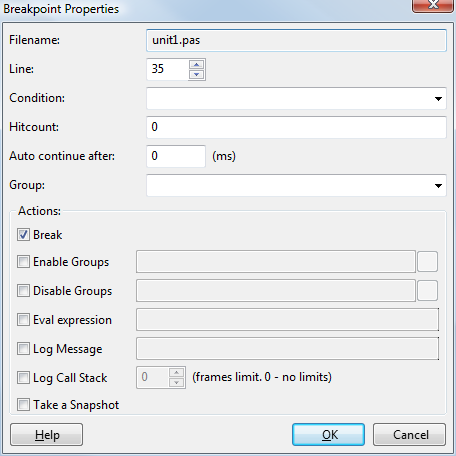
- Filename/Line
- Location of the breakpoint.
- Condition
- The breakpoint will only be triggered and perform the specified actions, if the condition evaluates to true. This can for example be used to test if a variable has reached a critical value.
Currently only very basic expressions are allowed. (GDB must be able to understand the expression.) - NOTE #1: The IDE does only apply a very limited pascal syntax fixing to the condition (#48 is escaped as char with ord val 48), so it needs to be C-like, so GDB understands the expression. eg: "i=2" or somechar='a'. Remember that the string (or rather char) value must be wrapper in single quotes, not double quotes.
- NOTE #2:
Strings can not be compared. They are seen as pchar, so they can only be compared to an address: "str=0x5a0b40".Chars in a string can be compared (index is zero based/pchar) "(s[0]='a')and(s[1]='b')". And strings can be compared as PChar (zero terminated): $_streq(^char(MyString), "ValueToCompare") (with double quotes) See: https://sourceware.org/gdb/onlinedocs/gdb/Convenience-Funs.html - Hitcount
- The breakpoint will be ignored until it has been hit the specified amount of times. One scenario where this is useful, if an event is triggered by the focus change (between IDE and debugged app) when the app is paused/resumed. The ignored passes of the breakpoint do not alter the focus.
- NOTE: #1 The hitcount starts at 0. So if you want to break on the 10th iteration, set the hitcount to 9.
- NOTE: #2 The hitcount doesn't reset until you stop/start the debugging or actually delete the breakpoint and set it again (without the need to stop/start the debug session).
- Pass count
- IDE shows here how many times the breakpoint was activated.
- Auto continue after
- This works when "Break" is checked. After breaking activates, IDE runs the specified pause and automatically resumes the program running after that pause. This also avoids the focus change between IDE and app. It however indicates the execution line in the source editor, which leads to a visible indication. If the time is long enough watches might be evaluated.
- Group
- A breakpoint can be in one group (one only). This option must be valid Pascal identifier. Groups can be used with the "Enable/Disable group" feature.
- Actions
-
- Break: Pause the application. The application can be continued with the Run command or any of the stepping commands.
- Enable/Disable Groups: Enable or Disable all breakpoints in the given group(s). Usually 2 breakpoints would be set, one to enable, the other to disable. The breakpoints in the specified groups could then be enabled (or disabled) only, if they occur between the 2 points. The breakpoints that are changed could be in subroutines, that are called sometimes between the 2 points, but also from other locations.
- Eval Expression: Evaluates the expression and writes the value to the debug event log.
- Log Message: Writes the message to the debug event log.
- Log Callstack: Writes the callstack to the debug event log.
- Take a snapshot: Evaluates all Watches, Locals, Callstack, Threads, and adds it to the snapshots in the History dialog.


